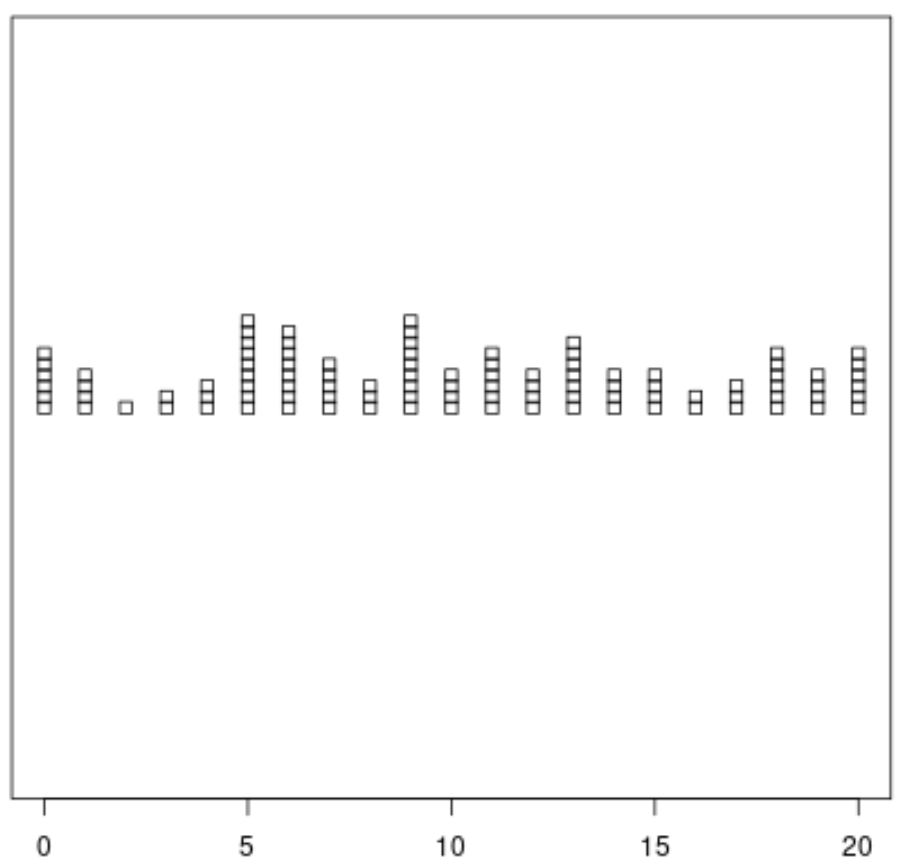
Dot plots are a simple yet effective way to visualize data. They are useful for displaying the distribution of a dataset and identifying patterns or outliers. Constructing a dot plot involves plotting each data point as a dot along a number line. Here’s how you can create a dot plot with ease.
1. Start by creating a number line that covers the range of your data. Label the number line with the appropriate scale to ensure that all data points can be accurately represented.
2. For each data point in your dataset, place a dot above the corresponding value on the number line. If there are multiple data points with the same value, you can stack the dots vertically to represent frequency.
3. Use different colors or shapes for the dots to differentiate between different categories or groups within your dataset. This can help highlight any trends or patterns that may exist in the data.
4. Add a title to your dot plot that clearly describes the dataset being represented and any important details about the data. You can also include a key or legend if you are using different colors or shapes to represent different groups.
5. Finally, make sure to include a clear and concise explanation of the dot plot to help viewers understand the data being presented. This can include information about the distribution of the data, any outliers, or any patterns that may be evident.
By following these steps, you can easily construct a dot plot to visualize your data in a clear and concise manner. Dot plots are a versatile and powerful tool for displaying data and can help you gain valuable insights from your dataset.
In conclusion, constructing a dot plot is a straightforward process that can provide valuable insights into your data. By following the steps outlined above, you can create a clear and informative visualization of your dataset that can help you identify patterns, outliers, and trends. Dot plots are a useful tool for any data analyst or researcher looking to make sense of their data.
