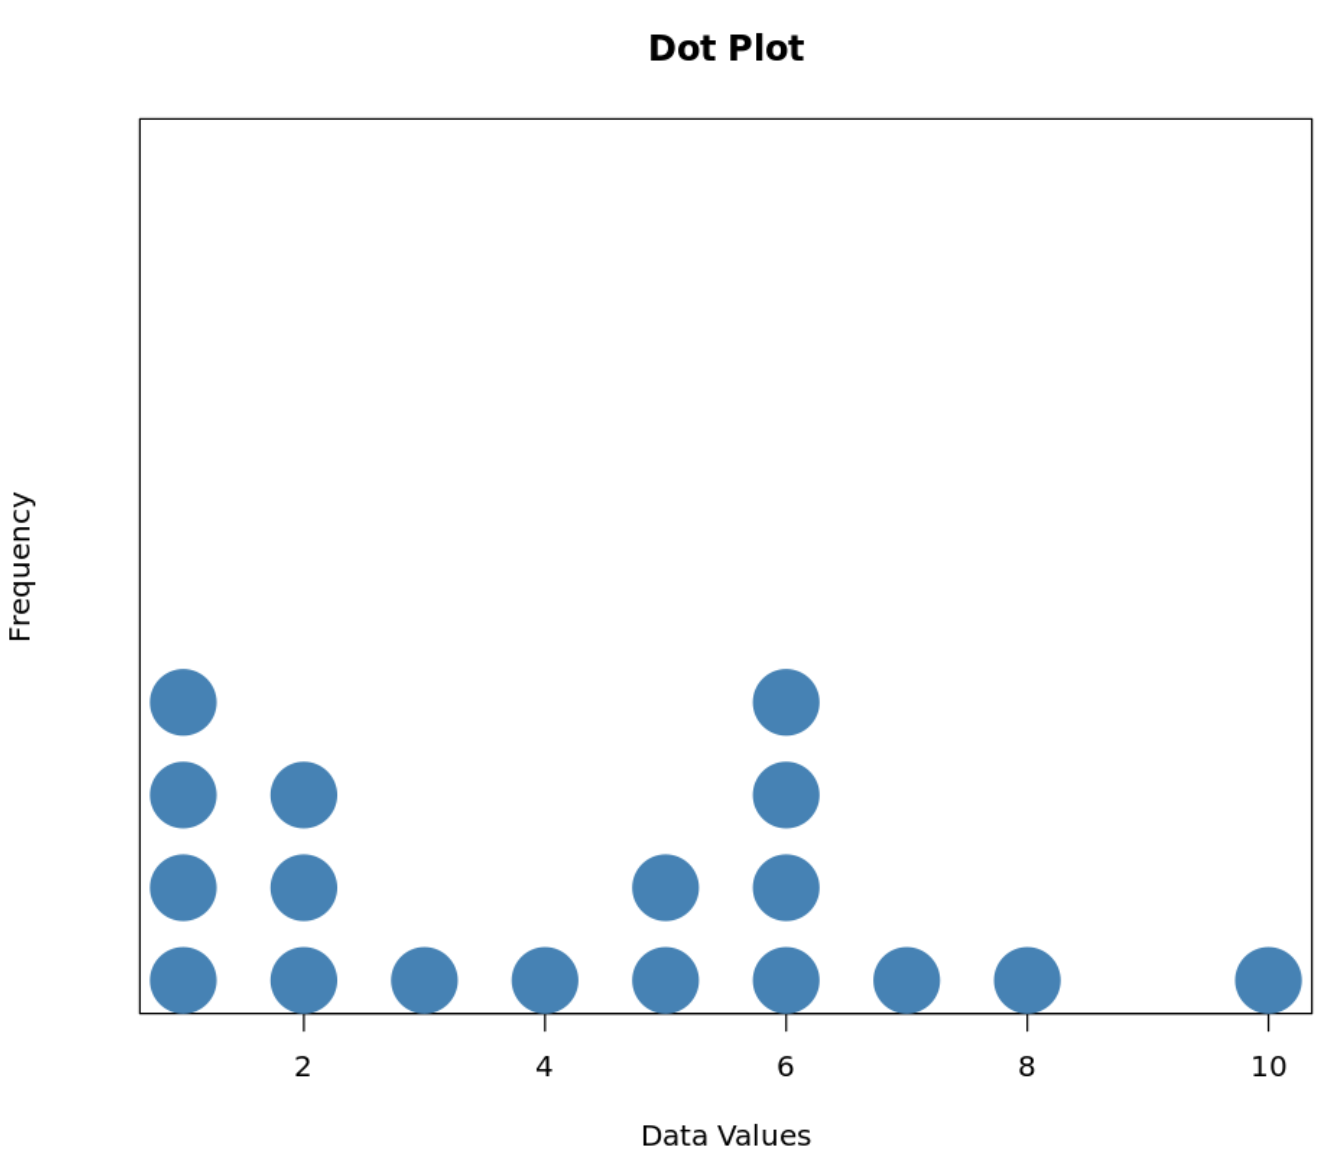
In statistics, a dot plot is a simple way to visualize data that shows each data point as a dot on a number line. Finding the mean on a dot plot can be a useful way to understand the central tendency of the data set. By calculating the mean, you can determine the average value of the data points. Here’s how you can find the mean on a dot plot.
To begin finding the mean on a dot plot, you first need to identify the data points represented by the dots on the plot. Each dot on the plot corresponds to a specific value in the data set. By examining the dot plot, you can determine the frequency of each data point and their distribution along the number line. This information will help you calculate the mean of the data set.
Calculating the Mean
Once you have identified the data points on the dot plot, you can begin calculating the mean. To find the mean, you need to add up all the data points and then divide by the total number of data points. For example, if you have a dot plot with the following data points: 2, 4, 6, 8, and 10, you would add them up (2 + 4 + 6 + 8 + 10 = 30) and then divide by the total number of data points (5), resulting in a mean of 6.
Another way to calculate the mean on a dot plot is to use the frequency of each data point. In this method, you multiply each data point by its frequency (the number of times it appears on the dot plot), add up the products, and then divide by the total number of data points. This method can be particularly useful when dealing with data sets with repeated values.
After calculating the mean on a dot plot, you can use this value to better understand the central tendency of the data set. The mean provides a measure of the average value of the data points and can help you make comparisons and draw conclusions about the data. By finding the mean on a dot plot, you can gain valuable insights into the distribution and characteristics of the data set.
In conclusion, finding the mean on a dot plot is a straightforward process that can help you better understand the central tendency of a data set. By identifying the data points on the dot plot and calculating the mean, you can determine the average value of the data points and gain insights into the distribution of the data. Whether you are analyzing a small data set or a larger data set with repeated values, calculating the mean on a dot plot can be a valuable tool in statistical analysis.
